- | Home |
- Company |
- Contact |
- News |
- S/ware Eng |
- Standards |
- Academic Support |
- Documents |

- | Requirements |
- Compilers |
- Validation |
- RTOS |
- Analysis |
- Hardware |
- Software |
- Resources |
- Products |
Segger Embedded Studio: Debugger

SEGGER Embedded Studio is a streamlined and powerful C/C++ IDE (Integrated Development Environment) for ARM microcontrollers. It is specifically designed to provide you with everything needed for professional embedded development: an all-in-one solution aiming at stability and a continuous workflow.
SEGGER Embedded Studio integrates a feature-packed graphical debugger with J-Link integration for direct debugging on your target hardware. All well-known J-Link features can be used with SEGGER Embedded Studio.
The debugger includes various Debugging Windows, which are necessary for advanced information about the running application and its execution, including mixed-mode disassembly alongside with the source code, an I/O Terminal and a scriptable Threads Window to be used with any (real time) OS.
Debugging your Application
Connect your J-Link and the target device to your computer. Open Target -> Connect and select SEGGER J-Link. SEGGER Embedded Studio will now connect to your target device. The status is shown in the Output Window and the Status Bar.
Start Debugging. Instead of running the Simulator SEGGER Embedded Studio will now download the application into the memory of your target. After downloading it runs to main(), too. Let it run and you will see the printf output in the Target Terminal. When the application is finished at the exit_loop, stop the debug session.
After you have built your Application you can load it onto your target hardware and examine its execution.
To do this connect your J-Link and the target device to your computer. Open Target → Connect and select SEGGER J-Link to connect to your device. The Output Window and the Status Bar show the connection status.
Start Debugging via Debug → Go (F5). Your application is now loaded to the target memory, a Breakpoint is set at main() and the Application runs. When it reaches main you can see the line highlighted in the Source Code Editor and pointed to by an arrow Icon.
You can now let your application run, step through it, set Breakpoints and examine the execution of your Application.
SEGGER Embedded Studio includes various Debug Information Windows which help you with the examination.
Debug Information Windows
Source Code Editor |
||
|---|---|---|
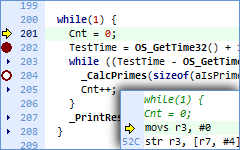
The most used Window is the Source Code Editor. In Debugging Mode it shows you where your application is currently halted. |
 |
|
Debug Terminal |
||
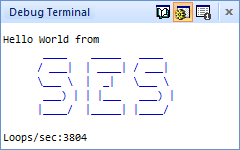
The Debug Terminal displays output of your target Application, for example done with printf and RTT. |
 |
|
Watch Windows |
||
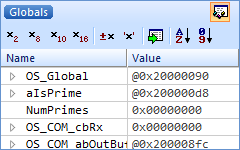
SEGGER Embedded Studio includes different Watch Windows to examine variables. |
 |
|
Threads Window |
||
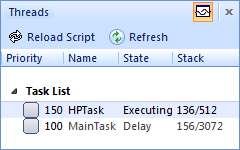
The Threads Window allows OS aware debugging. When you are debugging a (real time) OS like → embOS, the Threads Window can show the running Tasks / Threads of your Application and their status. With a double-click on a Thread you can switch to it to examine its Registers and Call Stack. |
 |
|
Registers Window |
||
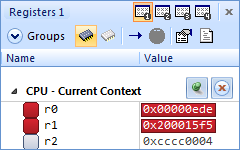
The Registers Window shows the CPU Registers as well as Memory Mapped Registers (MMRs, Peripheral Registers). |
 |
|
Call Stack Window |
||
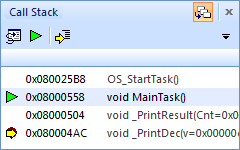
The Call Stack Window shows in which function the application is currently halted and its callers up to the top level. You can double-click on each caller to examine the exact location of the call and get additional information about the calling function, like its local variables. |
 |
|
Code and Data Breakpoints |
||
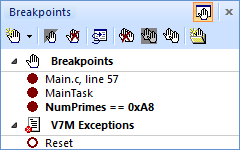
The SEGGER Embedded Studio debugger features code breakpoints on instructions, functions, and source lines, as well as data breakpoints upon access of variables in memory. |
 |
|
